Compare decimals on number lines
key notes :
🔢 What is a Decimal Number Line?
A number line that shows numbers between whole numbers using decimal points.
Example: 0 ➖ 0.1 ➖ 0.2 ➖ … ➖ 1.0
🎯 Identify Place Value First
- Tenths (0.1) 🟠
- Hundredths (0.01) 🟡
➡️ A number line can be divided into 10 equal parts (tenths) or 100 equal parts (hundredths).
📍 Plot the Decimal on the Line
Find where the decimal lies between two whole numbers.
Example: 0.6 lies between 0 and 1, 6 steps after 0.
🔼🔽 Compare Using Position
- The number to the right 👉 is greater
- The number to the left 👈 is smaller
Example: On a number line, 0.7 > 0.5 because 0.7 is to the right.
🧠 Use Benchmarks to Compare
Use known decimals like:
- 0.5 = half 🟪
- 0.25 = quarter 🔷
They help in quick comparison!
➗ Equal Intervals Matter
Always check that the number line is evenly divided.
If divided into 10 equal parts = tenths
If into 100 equal parts = hundredths
🧩 If Needed, Rewrite Decimals
Add a zero to compare easily:
0.6 = 0.60
0.60 > 0.58
🥇 Rules to Remember
| Symbol | Meaning | Example |
|---|---|---|
| > | Greater than | 0.9 > 0.4 |
| < | Less than | 0.3 < 0.8 |
| = | Equal to | 0.50 = 0.5 |
✅ Quick Comparing Trick
Look at the tenths first, if same, then compare hundredths.
🌈 Example
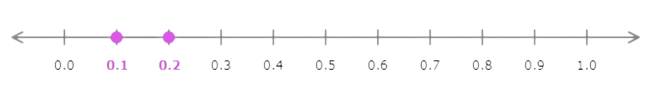
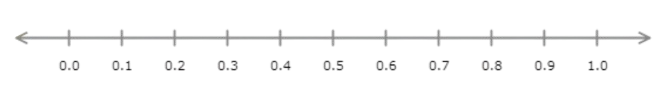
Number line:
0 — 0.1 — 0.2 — 0.3 — 0.4 — 0.5 — 0.6 — 0.7 — 0.8 — 0.9 — 1.0
Compare 0.4 and 0.6
👉 0.4 is left, 0.6 is right → 0.6 is greater
Learn with an example
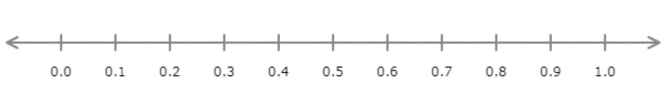
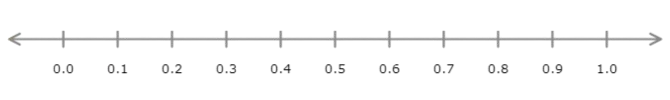
Graph 0.2 and 0.1 on the number line.
Which number is closer to 0.0?
- 0.2
- 0.1
Graph 0.2.
Find 0.2 on the number line and graph the point.
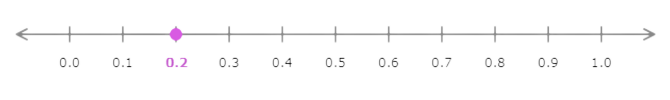
Graph 0.1.
Find 0.1 on the number line and graph the point.
Compare 0.2 and 0.1.
0.1 is closer to 0.0.
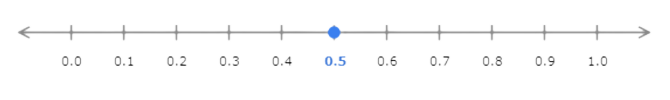
Graph 0.5 and 0.7 on the number line.
Which number is closer to 1.0?
- 0.5
- 0.7
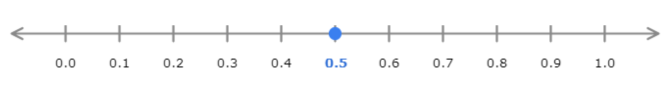
Graph 0.5.
Find 0.5 on the number line and graph the point.
Graph 0.7.
Find 0.7 on the number line and graph the point.
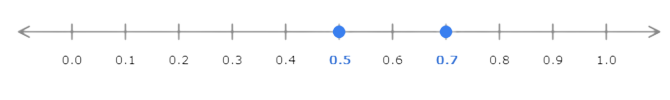
Compare 0.5 and 0.7.
0.7 is closer to 1.0.
Graph 0.5 and 0.3 on the number line.
Which number is closer to 0.0?
- 0.5
- 0.3
Graph 0.5.
Find 0.5 on the number line and graph the point.
Graph 0.3.
Find 0.3 on the number line and graph the point.
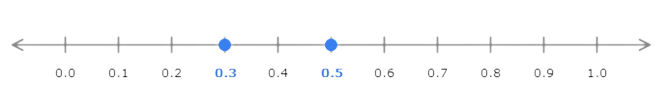
Compare 0.5 and 0.3.
0.3 is closer to 0.0.
Let’s practice!