Interpret line plots
key notes :
Definition of a Line Plot
- A line plot is a graph that displays data using a number line.
- It shows frequency (how often something occurs) with X’s, dots, or marks above the numbers.
Understanding the Components of a Line Plot
- Title: Explains what the data represents.
- Number Line: The horizontal axis that represents the values of data.
- Data Points: Symbols (like X’s or dots) that show how many times a value appears.
Steps to Interpret a Line Plot
- Identify the title to understand what the data represents.
- Look at the number line to see the range of values.
- Count the X’s or dots above each number to determine frequency.
- Analyze patterns and trends (e.g., most common or least common value).
Answering Questions from a Line Plot
- Find the mode (most frequent value).
- Identify gaps or clusters in the data.
- Compare values (e.g., “How many more times did this value occur compared to another?”).
- Solve word problems involving addition, subtraction, multiplication, or division based on the data.
Using Line Plots with Fractions
- Line plots can also represent data in fractions (e.g., measuring liquid amounts or lengths).
- Understanding how to add or subtract fractions helps in interpreting fractional line plots.
Learn with an example
👉 Mr. Pittman, the English teacher, had his students track the number of books they read last month.
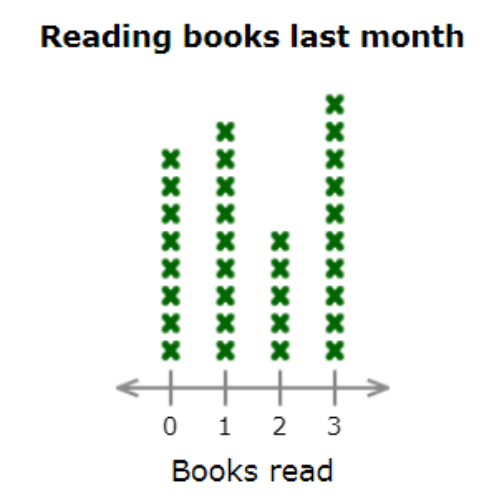
How many students read exactly 2 books last month?
______students
Count all the X’s in the column for 2 books last month. 5 students read exactly 2 books last month.
👉 A science teacher asked her students how many times they went to the science museum last year.
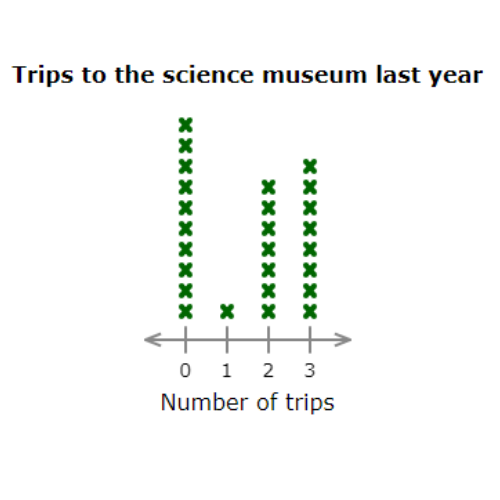
How many students went to the science museum fewer than 2 times?
______ students
Count all the X’s in the columns for 0 or 1 times. There are 11 X’s. 11 students went to the science museum fewer than 2 times.
👉 Some people took photos while visiting the zoo.
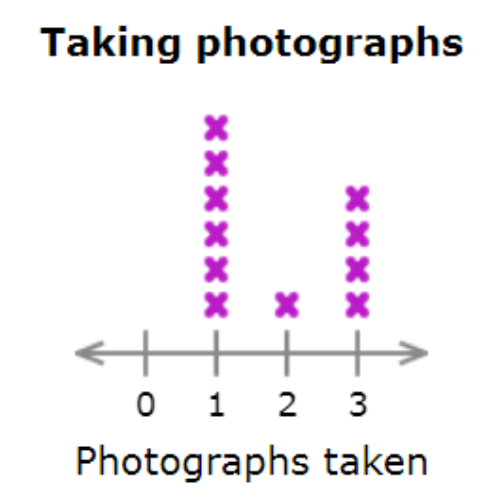
How many people took more than 2 photographs?
_______ people
Count all the X’s in the column for 3 photographs. There are 4 X’s. 4 people took more than 2 photographs.
Let’s practice!🖊️