Create line plots
key notes :
Definition of Line Plot:
A line plot is a graphical representation of data using a number line. It shows frequency (how many times a number appears) by placing marks (or dots) above the corresponding value on the number line.
Understanding Data:
To create a line plot, you first need a set of data. This data can represent anything like heights, temperatures, test scores, etc. Each data point is represented by a dot above its corresponding value on the number line.
Creating a Number Line:
Draw a horizontal line and label it with the range of values that represent the data. The number line should be spaced evenly to show the values clearly.
Plotting the Data:
For each data point, place a dot or mark above the correct value on the number line. If a value repeats, place multiple dots above that value.
Reading a Line Plot:
Once the dots are plotted, you can easily see how often a value occurs by counting the dots above each value. This helps in identifying trends, modes, or frequencies in the data.
Example:
If the data set is the number of pets owned by a group of students, the values might be: 1, 2, 3, 2, 1, 4. The number line might go from 0 to 4, and you would plot dots above 1, 2, 3, and 4 accordingly.
Interpreting Data:
A line plot helps in comparing the frequency of different values. For example, if you see the most dots above 2, you can conclude that most students have 2 pets.
Learn with an example
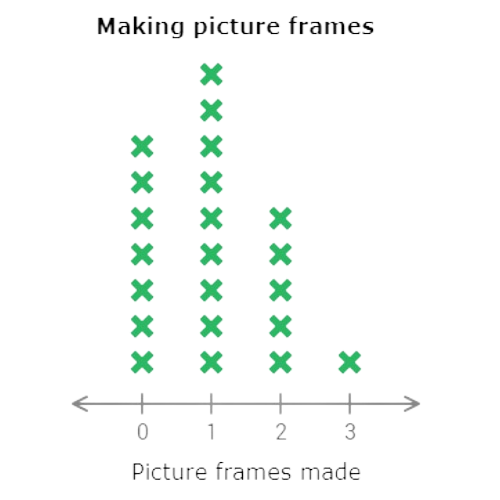
👉 The shop teacher wrote down how many picture frames the students made last week.
Use the data to complete the line plot below.
Making picture frames
0 0 0 0 0 0 0 1 1 1 1 1 1 1 1 1 2 2 2 2 2 3
Click to select the X’s. To clear a column, click on the number line below it.
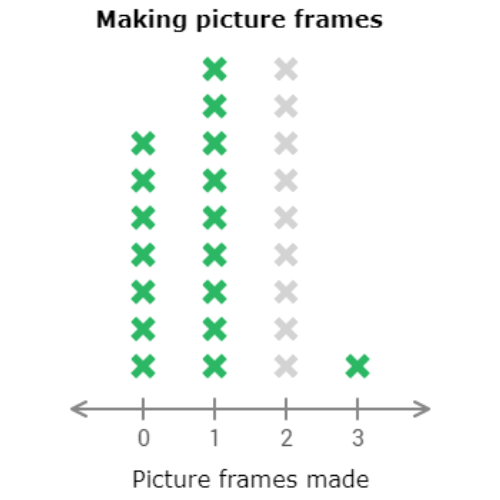
The first missing piece of data is for 2. Count how many times 2 appears in the list. It appears 5 times. 5 students made exactly 2 picture frames. Select 5 X’s in the column above 2.
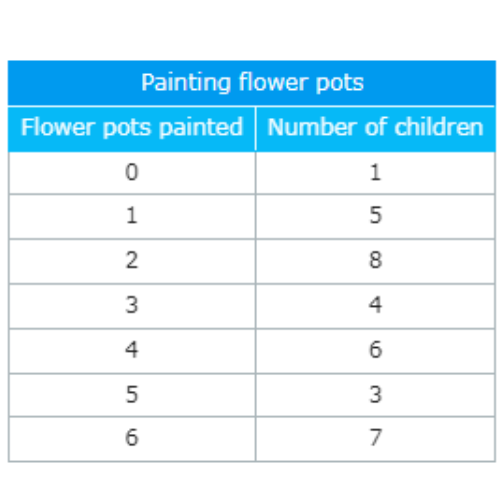
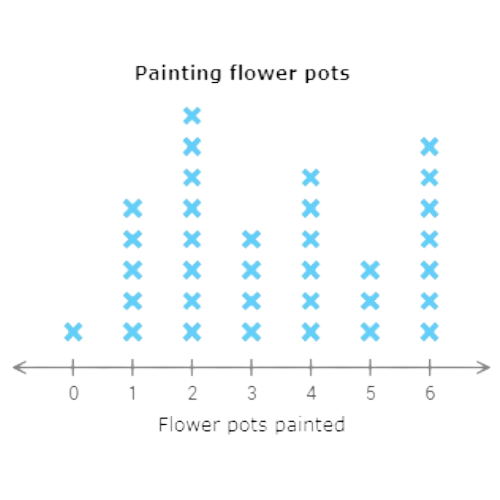
👉 The art teacher wrote down how many flower pots each child painted last week.
Use the data in the table to complete the line plot below.
Click to select the X’s. To clear a column, click on the number line below it.
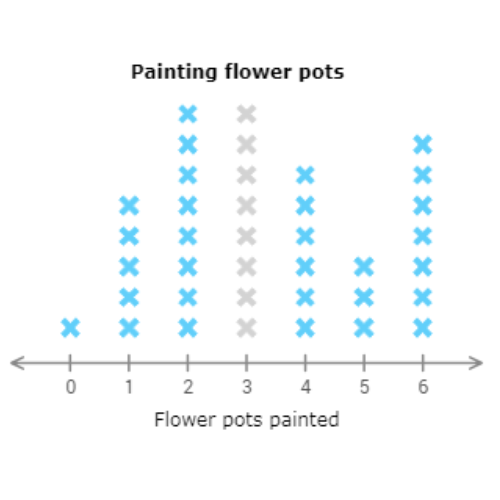
The first missing piece of data is for 3. Find the row for 3 in the table. 4 children painted exactly 3 flower pots. Select 4 X’s in the column above 3.
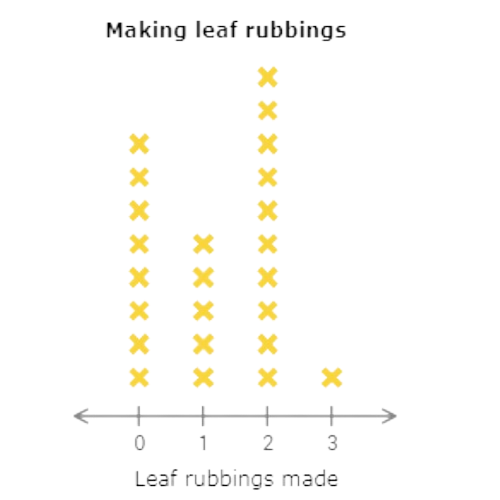
👉 Mrs. Robinson’s class counted the number of leaf rubbings they had made.
Use the data to complete the line plot below.
Making leaf rubbings
0 0 0 0 0 0 0 0 1 1 1 1 1 2 2 2 2 2 2 2 2 2 2 3
Click to select the X’s. To clear a column, click on the number line below it.
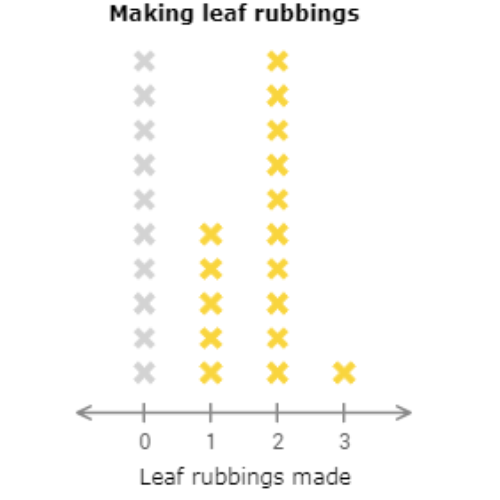
The first missing piece of data is for 0. Count how many times 0 appears in the list. It appears 8 times. 8 students made exactly 0 leaf rubbings. Select 8 X’s in the column above 0.
Let’s practice!🖊️