Frequency charts
key notes :
Definition:
A frequency chart is a way to organize and display data to show how often something occurs. It helps in summarizing large sets of data clearly and efficiently.
Columns of a Frequency Chart:
A typical frequency chart includes:
- Data Categories: The different items or groups you are counting.
- Tally Marks: A way to record the count visually using marks (four vertical lines and a fifth line through them for a group of five).
- Frequency: The number of times each category appears.
Steps to Create a Frequency Chart:
- Step 1: List all categories you want to count.
- Step 2: Count how many times each category occurs.
- Step 3: Record the tally marks for each category.
- Step 4: Write the frequency (total count) for each category next to the tally marks.
Example:
If students in a class are asked about their favorite fruit, the data might look like this:
- Apples: |||| (4)
- Bananas: |||||| (6)
- Oranges: |||| (4) The frequency for Bananas is 6, Apples is 4, and Oranges is 4.
Purpose: Frequency charts help in:
- Analyzing data easily.
- Comparing different categories.
- Identifying trends (which category occurs most or least often).
Using Frequency Charts for Graphs:
The data from a frequency chart can be used to create bar graphs, histograms, or pictographs for a visual representation.
Learn with an example
👉 A maths textbook explains probability by showing a set of cards numbered 4 through 9 and showing the number of people who might draw each card.
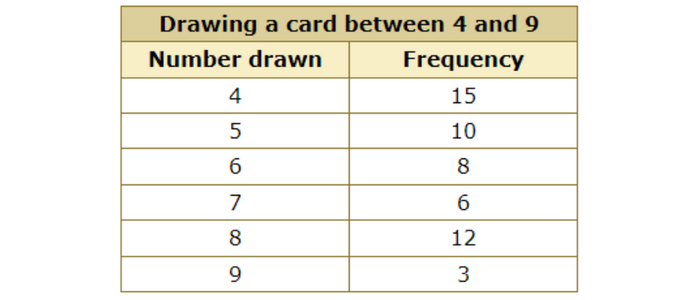
How many people drew a number less than 6?
Find the rows for 4 and 5. Add the frequencies for these rows.
Add:
15 + 10 = 25
25 people drew a number less than 6.
👉 To determine whether people make fewer trips to the films when the economy is bad, a reporter asked people how many films they saw last month.
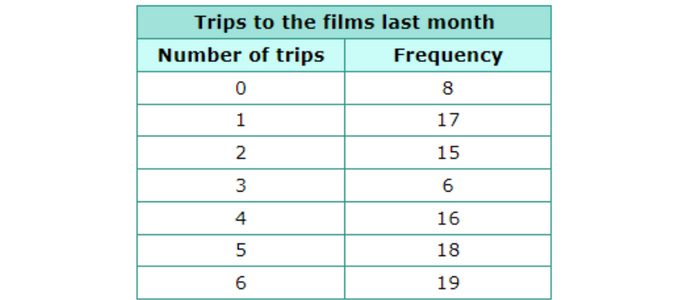
How many people went to the films more than 2 times?
Find the rows for 3, 4, 5, and 6 times. Add the frequencies for these rows.
Add:
6 + 16 + 18 + 19 = 59
59 people went to the films more than 2 times.
👉 While compiling photos for an album, Arianna noted the number of photographs taken by each of her friends and family.
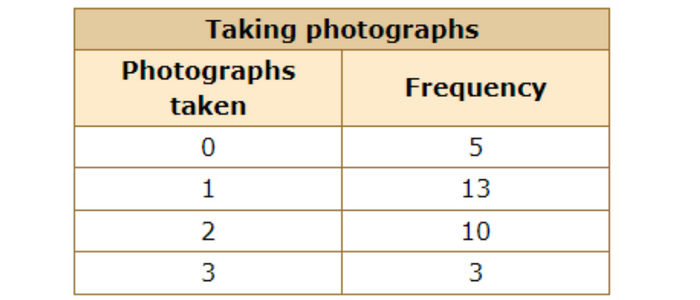
How many people took at least 1 photograph?
Find the rows for 1, 2, and 3 photographs. Add the frequencies for these rows.
Add:
13 + 10 + 3 = 26
26 people took at least 1 photograph.
Let’s practice!🖊️