Interpret line graphs
key notes :
Understanding Line Graphs
- A line graph is used to show changes over time.
- It consists of a horizontal axis (X-axis) and a vertical axis (Y-axis).
- Data points are connected by a line to show trends.
Components of a Line Graph
- Title: Describes what the graph is about.
- X-Axis: Represents the time period (e.g., days, months, years).
- Y-Axis: Represents the values being measured (e.g., temperature, sales, population).
- Data Points: Plotted values showing trends.
- Lines: Connect the data points to show movement or trends.
How to Read a Line Graph
Identify the title to understand the graph’s topic.
Look at the X-axis and Y-axis labels to know what is being measured.
Observe the trend:
- Upward trend: Increase in values.
- Downward trend: Decrease in values.
- Flat line: No change.
Interpreting Trends and Changes
- Identify highest and lowest points to understand peaks and dips.
- Compare values at different points in time.
- Notice if the change is steady, sudden, or fluctuating.
Solving Questions Based on Line Graphs
Use the graph to answer questions like:
- What is the value at a specific time?
- How much did the value increase or decrease?
- What was the trend over a specific period?
Learn with an example
⚫ The manager of Becky’s Cafe counted cups of coffee sold each day to determine the right quantity of coffee beans to roast.
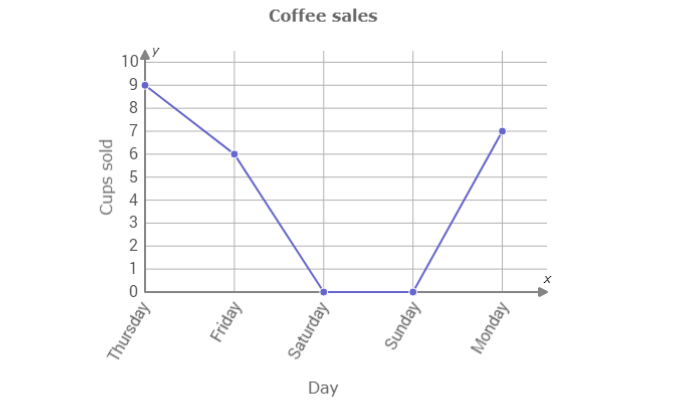
How many cups of coffee were sold on Thursday?
______ cups
Find Thursday on the graph. Look for the dot above Thursday.
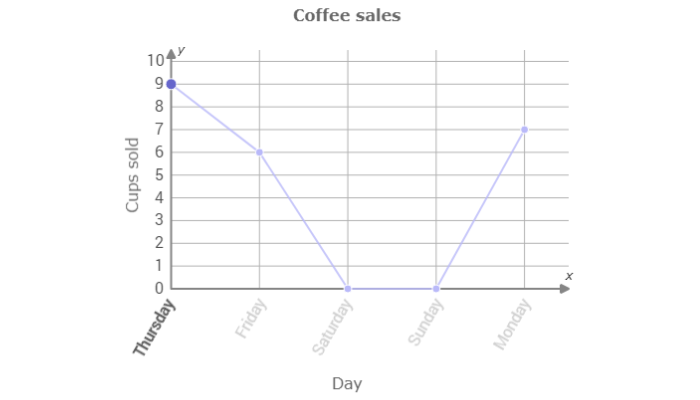
9 cups of coffee were sold on Thursday.
⚫ Seema, an ice cream parlour manager, counted the numbers of ice cream cones sold each day.
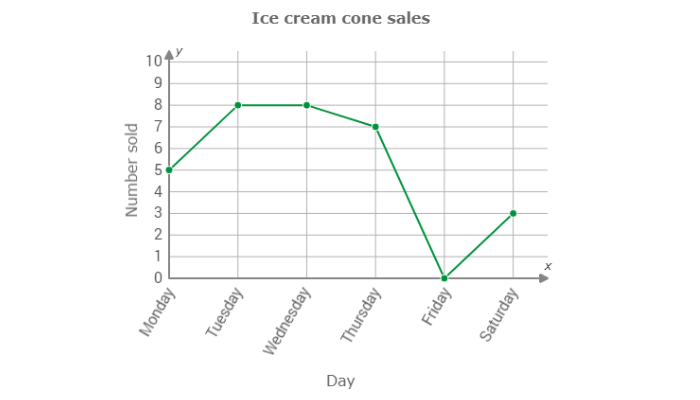
On which day were 3 ice cream cones sold?
- Monday
- Thursday
- Friday
- Saturday
Find 3 on the graph. Look for the dot that shows 3.
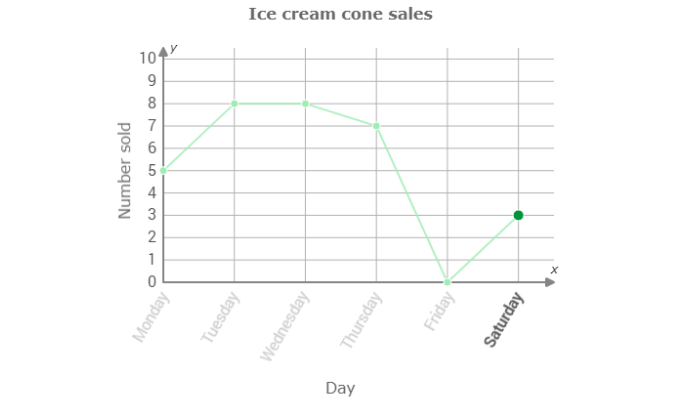
3 ice cream cones were sold on Saturday.
⚫ Neil kept track of the number of games his soccer team won each year.
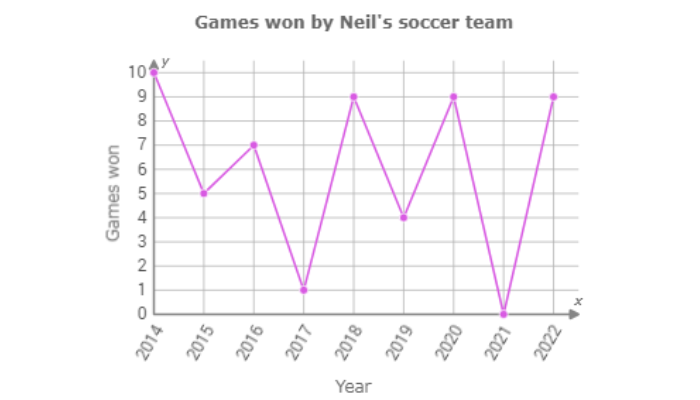
In which year did the soccer team win 7 games?
- 2014
- 2016
- 2017
- 2019
Find 7 on the graph. Look for the dot that shows 7.
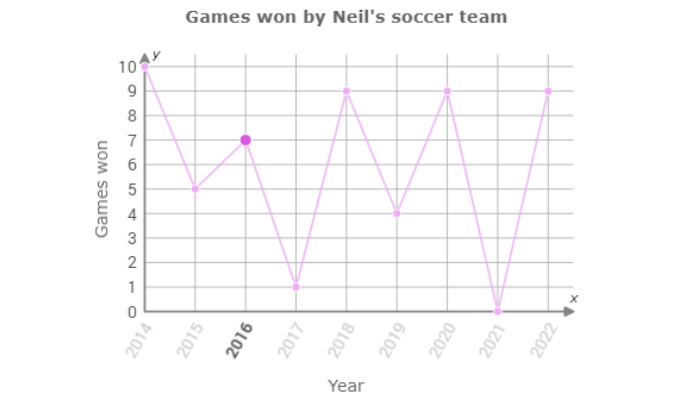
The team won 7 games in 2016.
Let’s practice!🖊️