Interpret bar graphs
key notes :
Understanding Bar Graphs
- A bar graph is a visual representation of data using bars of different lengths.
- Bars can be vertical or horizontal.
Parts of a Bar Graph
- Title: Explains what the graph is about.
- X-axis: Shows categories or groups.
- Y-axis: Represents numbers (frequency, amount, or percentage).
- Bars: Represent the data values.
- Scale: Indicates the units of measurement.
- Labels: Describe the categories and values.
Reading a Bar Graph
- Identify the title and understand what the graph represents.
- Check the labels on both axes.
- Look at the scale to determine the value of each bar.
- Compare the lengths of the bars to see patterns or trends.
Interpreting Data
- Find the highest and lowest values.
- Compare different categories.
- Identify trends (increase, decrease, or stable data).
- Answer questions like “Which category has the most/least?” or “How much more or less is one category than another?”
Creating Bar Graphs
- Collect and organize data.
- Choose an appropriate scale.
- Label the axes correctly.
- Draw bars accurately based on data values.
Real-Life Applications
- Used in surveys, population studies, sales reports, weather patterns, etc.
- Helps in making decisions based on data analysis.
Learn with an example
⚫ Steven, a birdwatcher, counted the number of each species of bird at the local county parks.
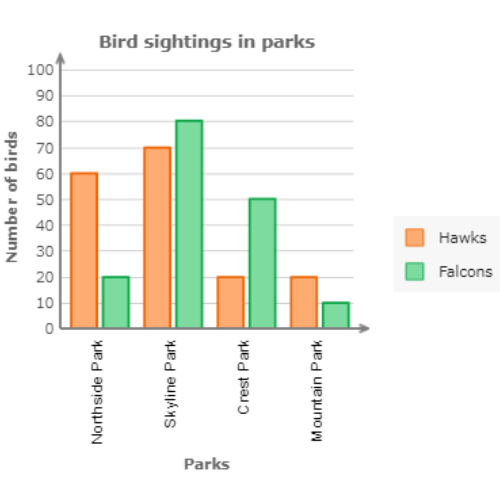
How many more birds were spotted in Northside Park than in Mountain Park?
____ birds
Find the bars for Northside Park and Mountain Park. Add together the values of the Northside Park bars. Then, add together the values of the Mountain Park bars.
Northside Park: 60 + 20 = 80
Mountain Park: 20 + 10 = 30
Now subtract:
80 − 30 = 50
50 more birds were spotted in Northside Park than in Mountain Park.
⚫ Finn kept track of how many laps he swam during the past 3 days.
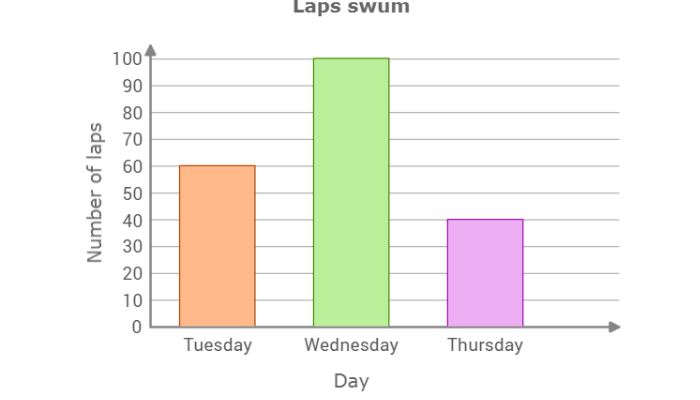
On which day did Finn swim the fewest laps?
- Tuesday
- Wednesday
- Thursday
Find the shortest bar on the graph.
The shortest bar is the Thursday bar.
Finn swam the fewest laps on Thursday.
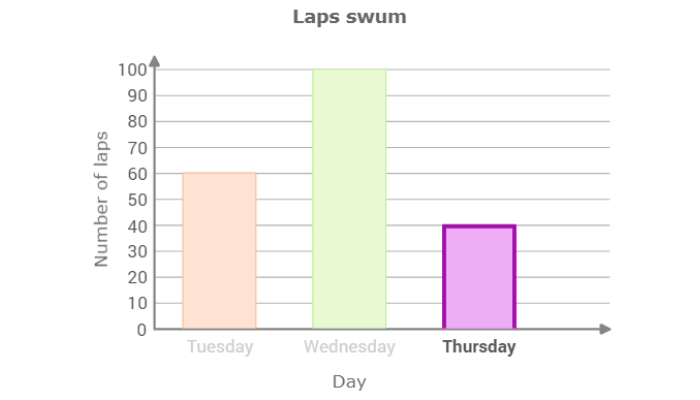
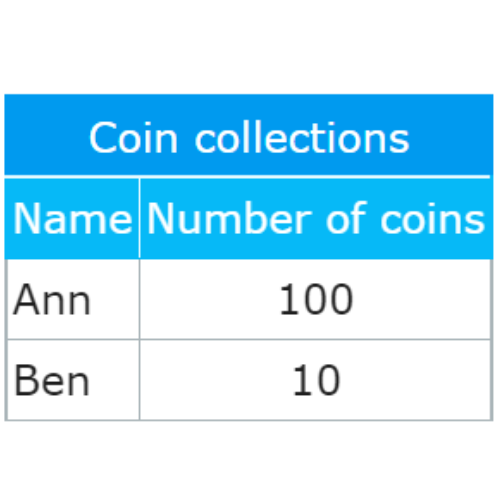
⚫ Some friends discussed the sizes of their coin collections.
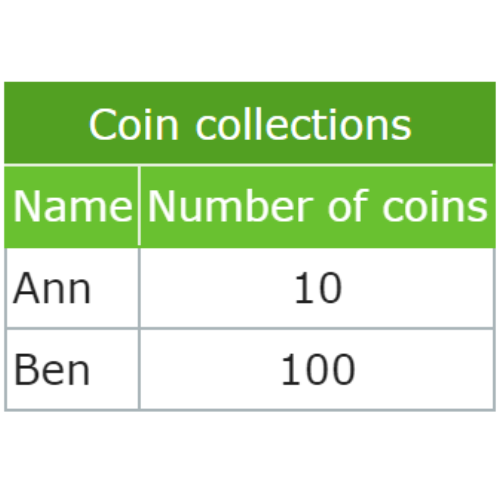
Which bar graph shows the same data?
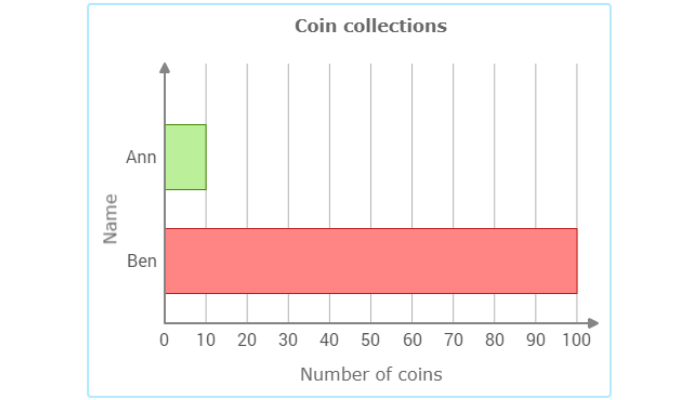
Read the data points off the first graph.

The first graph is correct, because all of its data points match the table.
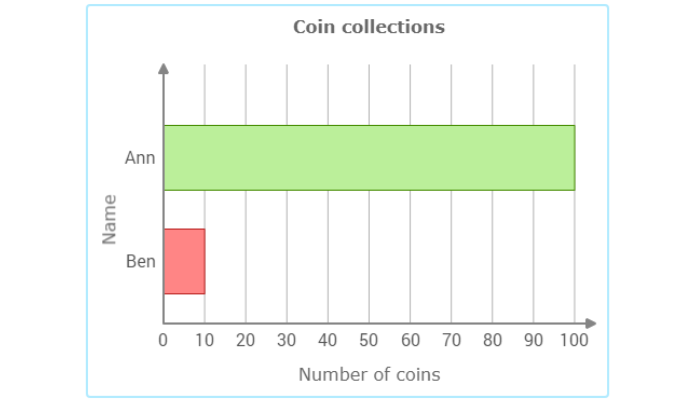
Read the data points off the second graph.
The second graph is incorrect. None of its data points match the table.
Let’s practice!🖊️