Create bar graphs
key notes :
Definition of Bar Graphs
- A bar graph is a visual representation of data using bars of different heights or lengths.
- It helps compare different categories of data.
Types of Bar Graphs
- Vertical Bar Graphs: Bars go up and down.
- Horizontal Bar Graphs: Bars go left to right.
Parts of a Bar Graph
- Title: Describes what the graph is about.
- X-axis (Horizontal Axis): Shows categories or groups.
- Y-axis (Vertical Axis): Represents numerical values.
- Bars: Show the quantity for each category.
- Labels: Identify the data in the graph.
Steps to Create a Bar Graph
- Step 1: Collect and organize data.
- Step 2: Choose a title that describes the data.
- Step 3: Label the x-axis and y-axis.
- Step 4: Decide on an appropriate scale for the y-axis.
- Step 5: Draw bars according to the data values.
- Step 6: Make sure bars are evenly spaced.
- Step 7: Check for accuracy and neatness.
Reading a Bar Graph
- Identify the title, axes, and labels.
- Look at the height/length of each bar to determine values.
- Compare bars to understand trends or differences.
Importance of Bar Graphs
- Helps in understanding and comparing data easily.
- Used in real-life situations like surveys, sales reports, and sports statistics.
Common Mistakes to Avoid
- Incorrect labeling of axes.
- Uneven spacing of bars.
- Using inconsistent scales.
- Misreading the height or length of bars.
Learn with an example
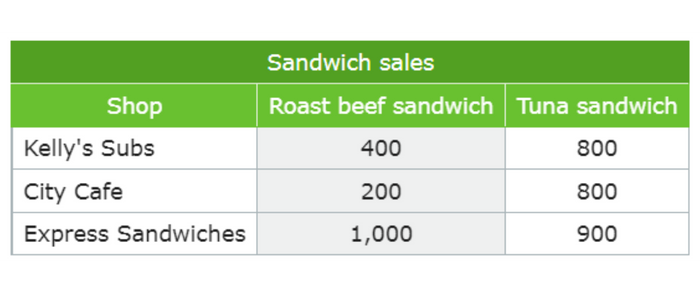
⚫ As part of a project for health class, Brooke surveyed local delis about the kinds of sandwiches sold.
Use the data in the table to complete the bar graph below.
Click to set the height of the missing bar.
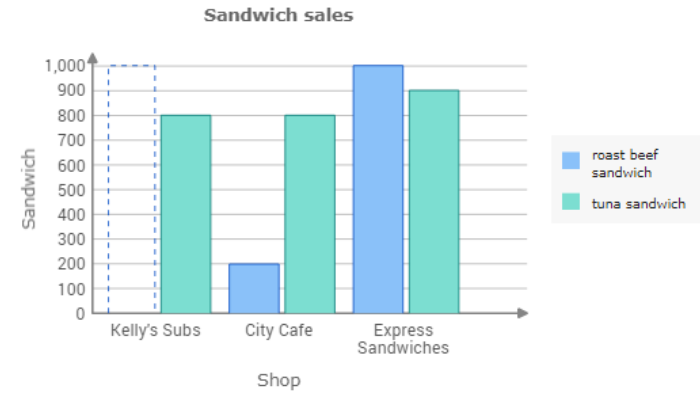
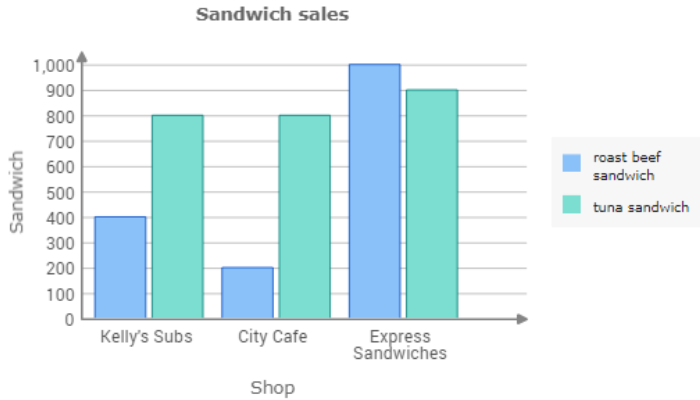
In the table, find the Kelly’s Subs row. Find the number in the roast beef sandwich column. Kelly’s Subs sold 400 roast beef sandwiches. Set the height of the missing bar to 400.
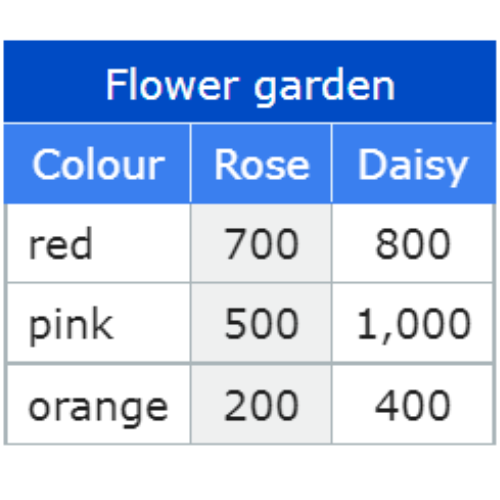
⚫ Gardeners at the White estate counted the number of flowers growing there.
Use the data in the table to complete the bar graph below.
Click to set the height of a missing bar.
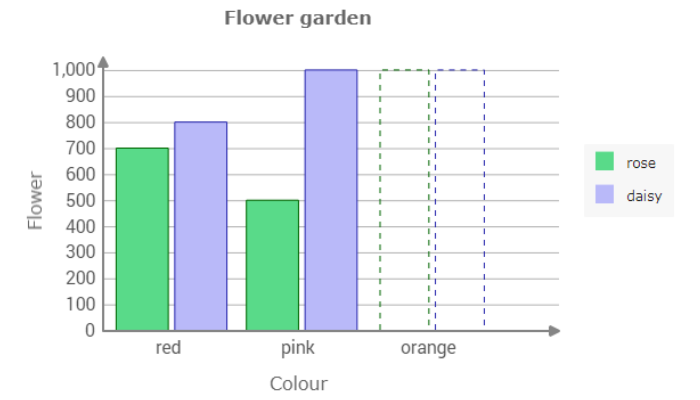
Start with the first missing bar. In the table, find the orange row. Find the number in the rose column. There are 200 orange roses in the garden. Set the height of the first missing bar to 200.
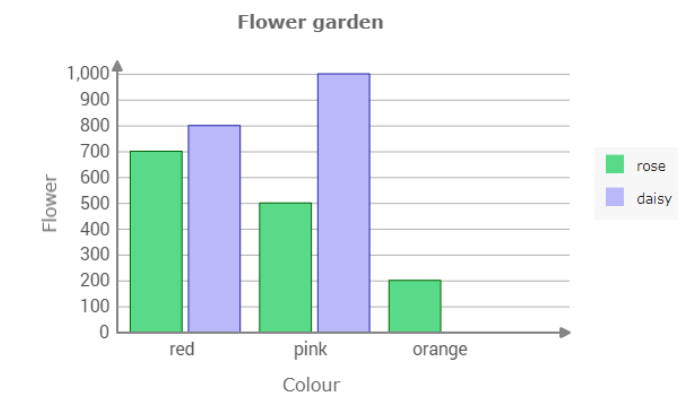
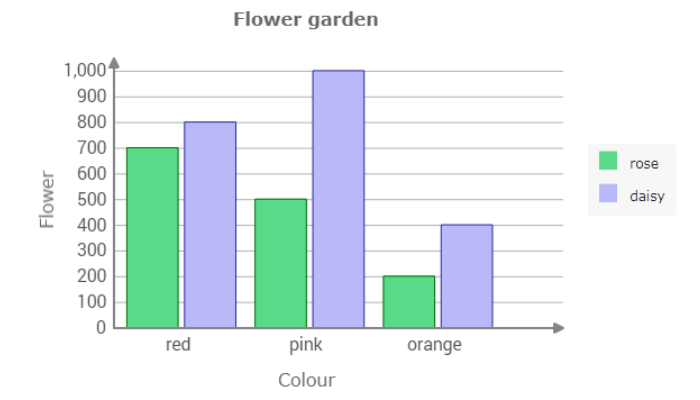
Look at the second missing bar. In the orange row of the table, find the number in the daisy column. There are 400 orange daisies in the garden. Set the height of the second missing bar to 400.
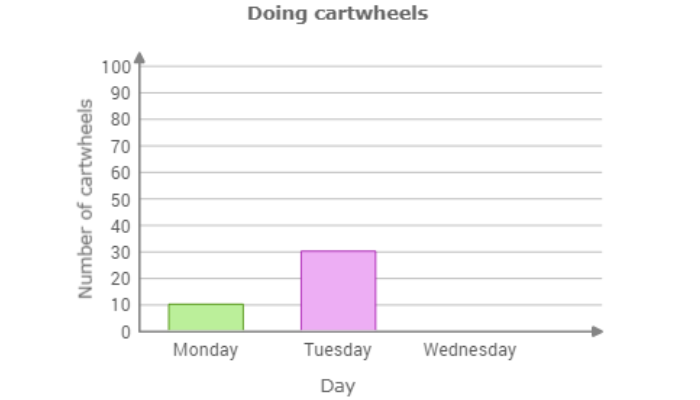
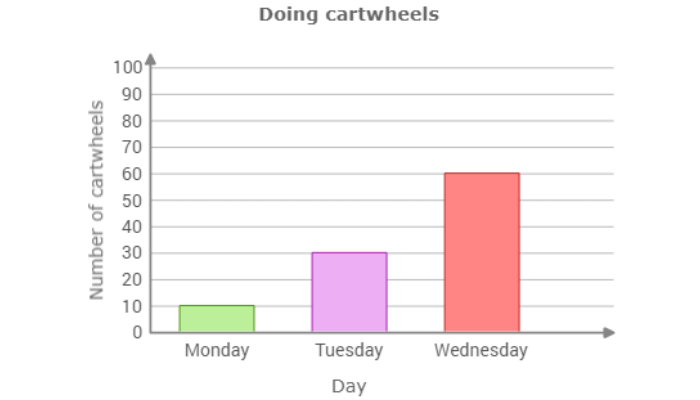
⚫ A gymnast did 10 cartwheels on Monday, 30 cartwheels on Tuesday and 60 cartwheels on Wednesday.
Use this data to complete the bar graph below.
Click to set the height of a missing bar.
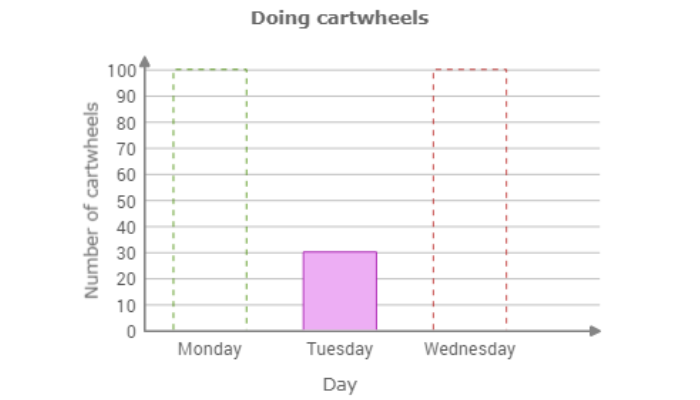
The first missing bar is for Monday. Set the height of the missing bar to 10.
The second missing bar is for Wednesday. Set the height of the missing bar to 60.
Let’s practice!🖊️