Interpret pictographs
key notes :
Definition of Pictographs
- A pictograph is a graphical representation of data using symbols or pictures.
- Each symbol or picture represents a specific quantity.
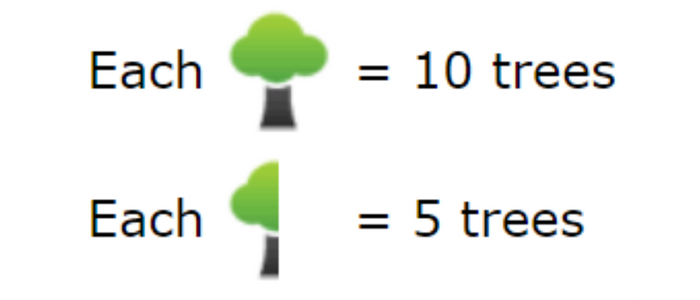
Understanding the Key (Legend)
- The key explains how much each symbol stands for (e.g., 🍎 = 5 apples).
- Some symbols may represent half or a fraction of the quantity.
Reading the Data
- Count the symbols carefully.
- Multiply the number of symbols by the value in the key.
- Compare different categories to find the highest or lowest values.
Analyzing Trends and Patterns
- Identify which category has the most or least symbols.
- Look for increases or decreases in values.
- Use the data to answer questions like “Which category has twice as much as another?”
Solving Word Problems Using Pictographs
- Convert pictorial data into numerical information.
- Answer questions based on given data (e.g., “How many more books were sold on Monday than Tuesday?”).
- Make simple calculations (addition, subtraction, multiplication, and division).
Creating Pictographs
- Choose a topic and data set.
- Decide on a suitable symbol and its value.
- Draw and label the pictograph clearly with a title and key.
Advantages of Pictographs
- Easy to understand and visually appealing.
- Helps in quick comparison of data.
- Useful for representing simple data sets.
Limitations of Pictographs
- Not suitable for large or complex data.
- Difficult to represent exact values if symbols do not divide evenly.
Learn with an example
🩸 Look at this pictograph:
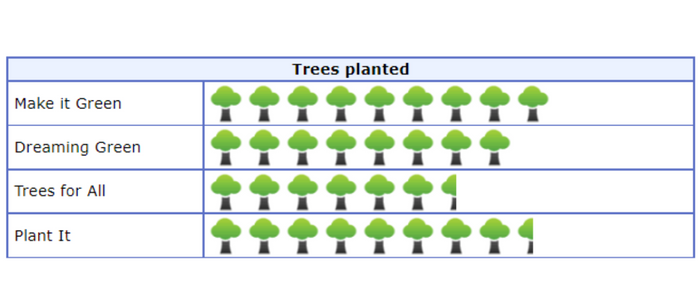
How many trees did Plant It plant?
______ trees
Count the symbols for Plant It. Count each full symbol as 10 and each half symbol as 5. Plant It planted 85 trees.
🩸 Look at this pictograph:
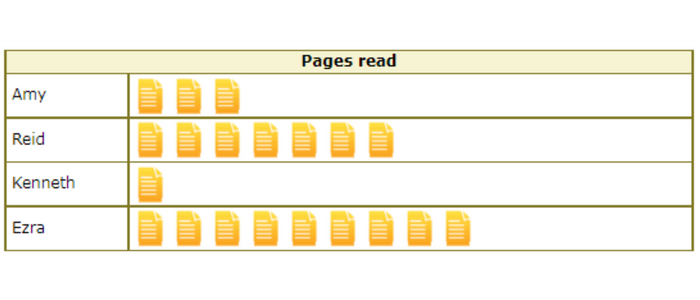

How many pages did Ezra read?
_______ pages
Count the symbols for Ezra. Count each symbol as 1. Ezra read 9 pages.
🩸 Look at this pictograph:
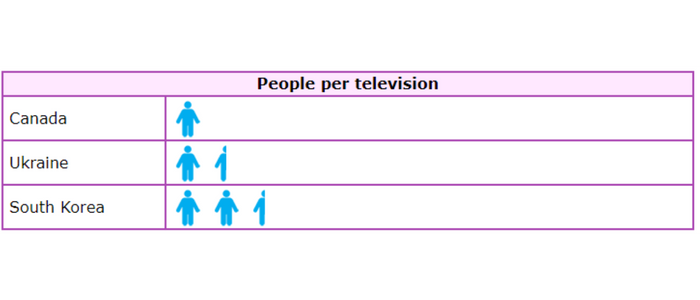

How many people per television are there in Ukraine?
_____ people
Count the symbols for Ukraine. Count each full symbol as 2 and each half symbol as 1. There are 3 people per television in Ukraine.
Let’s practice!🖊️