Create pictographs
Learn with an example
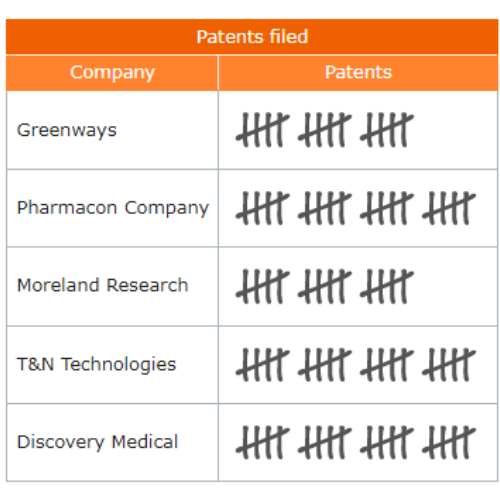
👉 Use the data in the tally chart to complete the missing row in the pictograph below.
Click to select the exclamation points.
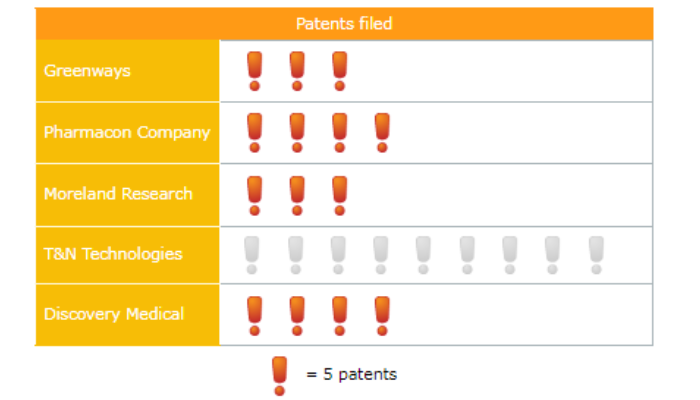
The missing row is for T&N Technologies. Count the tally marks for T&N Technologies. T&N Technologies filed 20 patents.
Each exclamation point is worth 5 patents. Divide:
20 ÷ 5 = 4
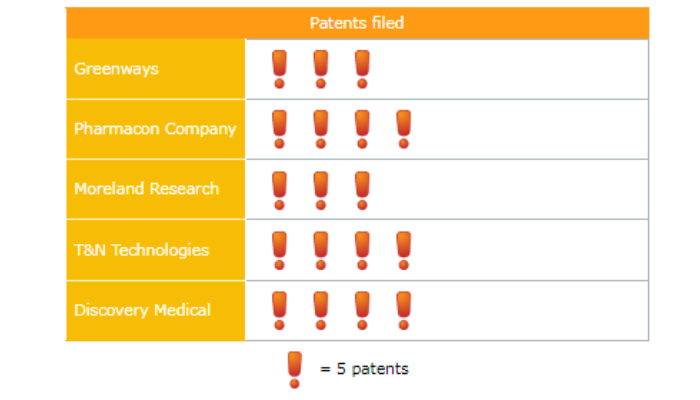
Put 4 exclamation points in the T&N Technologies row.
Your final pictograph should look like this:
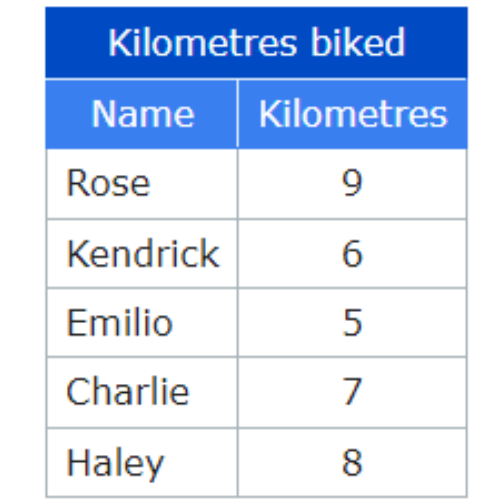
👉 Use the data in the table to complete the missing row in the pictograph below.
Click to select the bicycle tires.

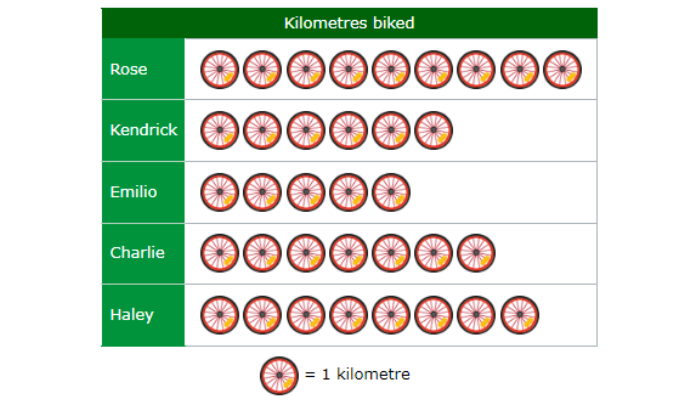
The missing row is for Rose. Find Rose in the table. Rose biked 9 kilometres.
Each bicycle tire is worth 1 kilometre. Put 9 bicycle tires in the Rose row.
Your final pictograph should look like this:
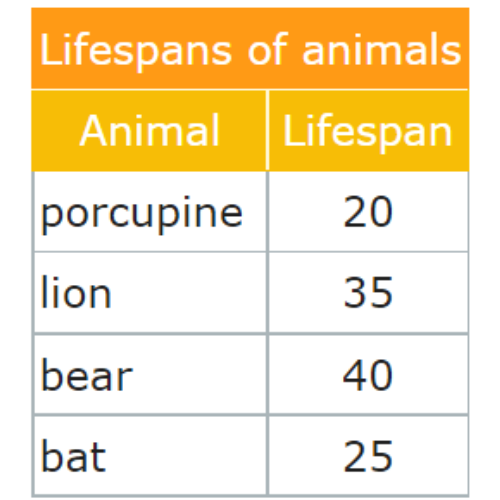
👉 Use the data in the table to complete the missing row in the pictograph below.
Click to select the clocks.
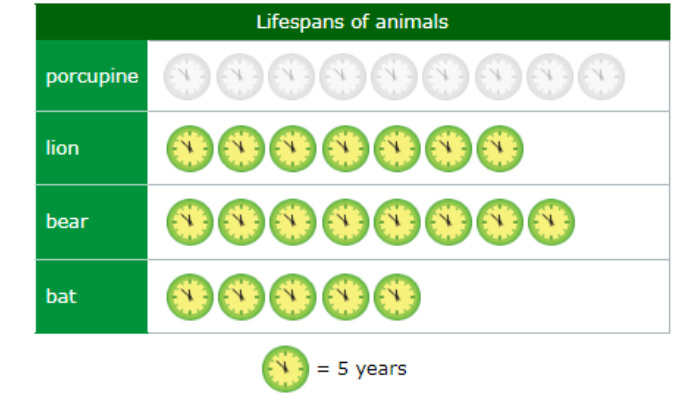
The missing row is for porcupine. Find porcupine in the table. The lifespan of a porcupine is 20 years.
Each clock is worth 5 years. Divide:
20 ÷ 5 = 4
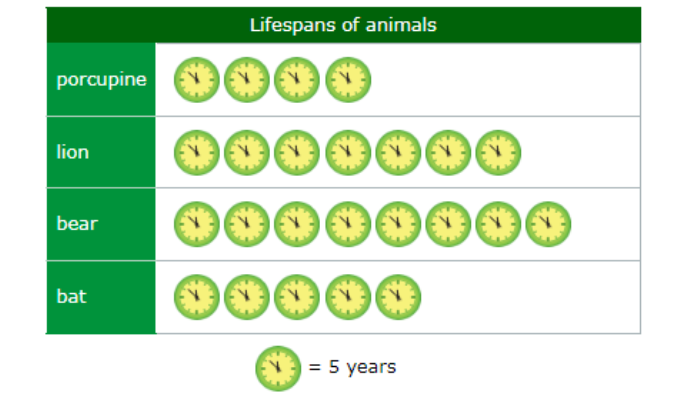
Put 4 clocks in the porcupine row.
Your final pictograph should look like this:
Let’s practice!🖊️