Interpret histograms
Key Notes :
Definition of a Histogram
- A histogram is a type of bar graph that represents data in ranges (intervals or bins).
- It shows how frequently different values or groups of values occur in a dataset.
Parts of a Histogram
- Title: Describes what the data represents.
- X-axis (Horizontal Axis): Shows the ranges or intervals of data.
- Y-axis (Vertical Axis): Represents the frequency (number of times data falls into each range).
- Bars: Show the count of data points in each range. The bars touch each other because the data is continuous.
How to Read a Histogram
- Look at the title to understand what the histogram is about.
- Check the x-axis to see the range of data values.
- Observe the y-axis to find the frequency of each interval.
- Compare the heights of bars to see which ranges have the most or least data points.
Difference Between a Histogram and a Bar Graph
- A histogram is used for numerical data with intervals, while a bar graph is used for categorical data.
- The bars in a histogram touch each other, but in a bar graph, they do not.
Interpreting Data from a Histogram
- Identify the interval with the highest bar (most common data).
- Identify the interval with the lowest bar (least common data).
- Determine if the data is spread evenly or concentrated in a particular range.
- Compare different intervals to understand trends and patterns.
Examples of Histograms in Real Life
- Temperature Ranges: How many days fall into certain temperature categories.
- Test Scores: How many students scored within specific score ranges.
- Height of Students: Number of students in different height categories.
Learn with an example
The advertising agency counted the number of billboards in each city in the state.
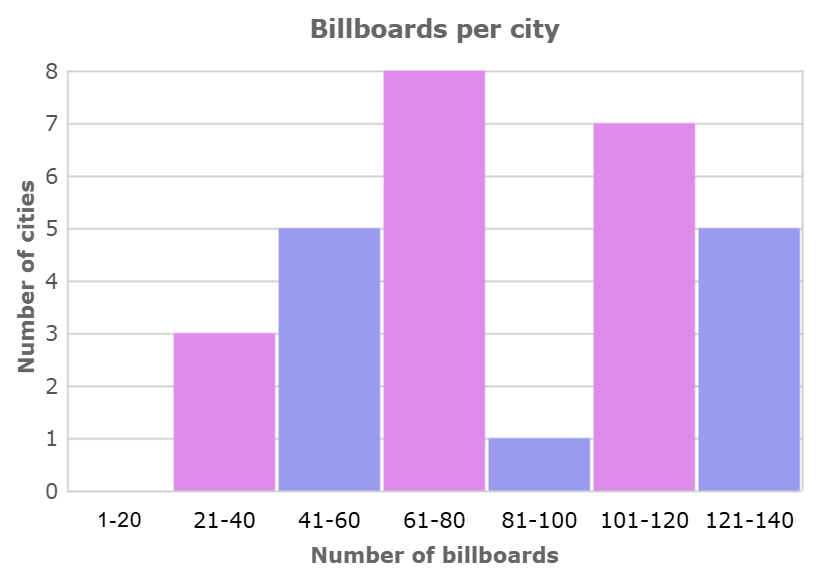
Are there fewer cities that have 101-120 billboards or cities that have 121-140 billboards?
- 101-120 billboards
- 121-140 billboards
Find the bar for the range 101-120 and the bar for the range 121-140. The bar for the range 121-140 is shorter.
There are fewer cities that have 121-140 billboards than cities that have 101-120 billboards.
A shipping company keeps track of the number of boxes in each shipment they send out.
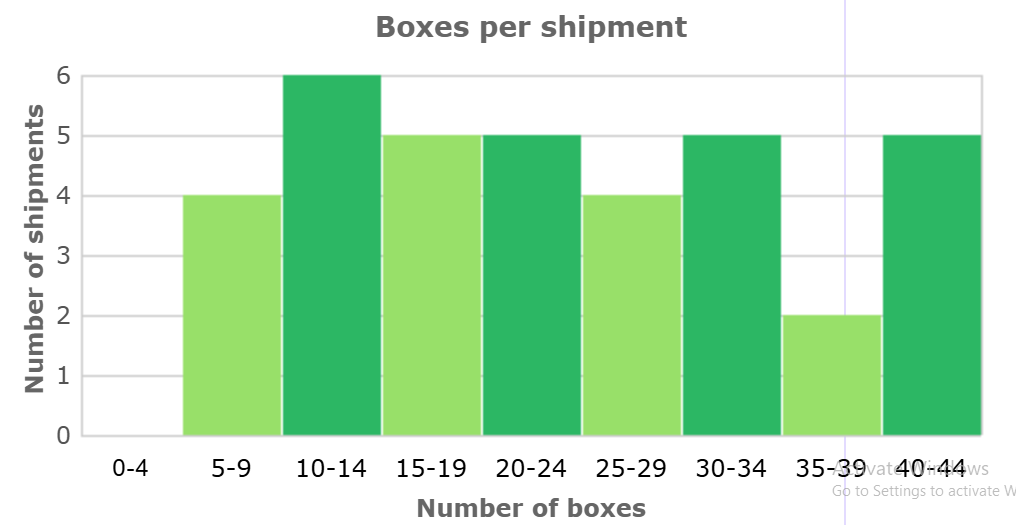
How many shipments are there in all?
_____ shipments
Read the height of each bar off the graph.
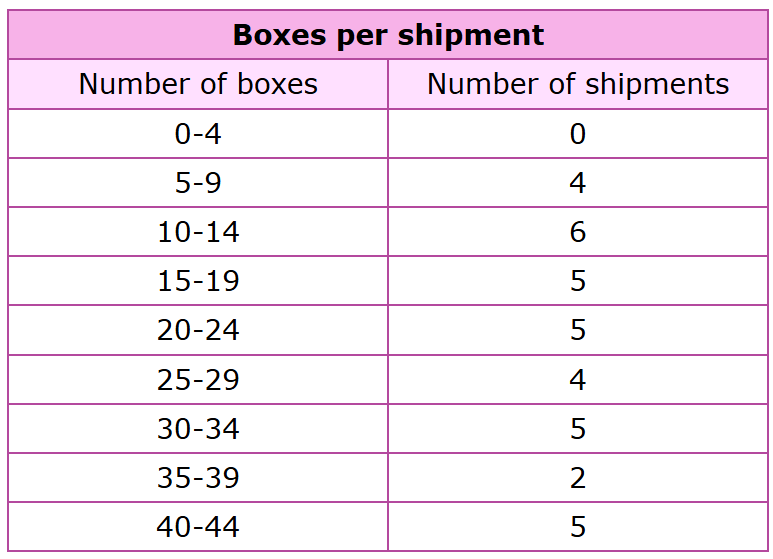
Add to find the total number of shipments.
| 0 + 4 + 6 + 5 + 5 + 4 + 5 + 2 + 5 | = | 36 |
There are 36 shipments.
Felipe counted all the beads in each necklace at the jewellery store where he works.
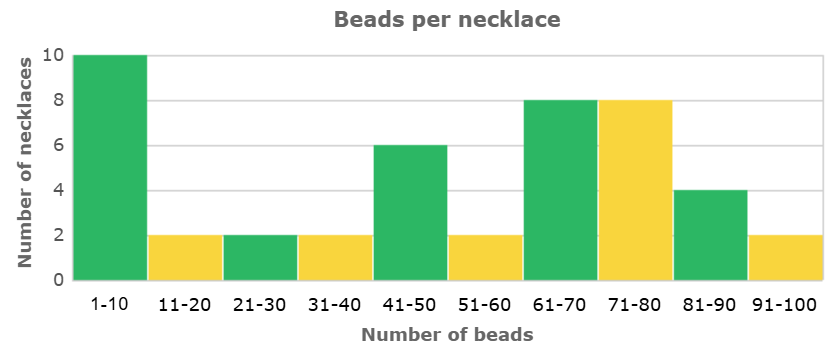
Are there fewer necklaces that had 21-30 beads or necklaces that had 61-70 beads?
- 21-30 beads
- 61-70 beads
Find the bar for the range 21-30 and the bar for the range 61-70. The bar for the range 21-30 is shorter.
There are fewer necklaces that had 21-30 beads than necklaces that had 61-70 beads.
Let’s practice!🖊️