Create histograms
key notes :
Definition of a Histogram
- A histogram is a type of bar graph that represents data in groups (or intervals) instead of individual numbers.
Understanding Data Intervals
- Data is divided into equal-sized intervals (e.g., 0–10, 11–20, etc.).
- Each interval has a corresponding frequency (how many times data falls into that range).
Difference Between a Histogram and a Bar Graph
- In a histogram, bars touch each other because data is continuous.
- In a bar graph, bars are separated because data categories are distinct.
Steps to Create a Histogram
Collect and organize data (e.g., test scores, heights, or ages).
Choose suitable intervals (equal width, like 0–5, 6–10, etc.).
Make a frequency table to count how many values fall into each interval.
Draw and label axes:
- X-axis: Represents the intervals.
- Y-axis: Represents frequency (number of occurrences).
Draw bars for each interval (height of the bar shows frequency).
Reading a Histogram
- Identify the highest and lowest frequencies.
- Compare different intervals to see trends in data.
- Understand patterns (e.g., most common values).
Real-Life Applications
- Analyzing test scores in a class.
- Checking temperature variations over a month.
- Understanding the number of books read by students in a library.
Common Mistakes to Avoid
- Using unequal intervals.
- Leaving gaps between bars.
- Forgetting to label axes properly.
Learn with an example
At a candy factory, butterscotch candies were packaged into bags of different sizes.
Use the data to complete the histogram below.
Butterscotch candies per bag
5 5 5 7 14 16 16 17 22 30 34 39 49 49
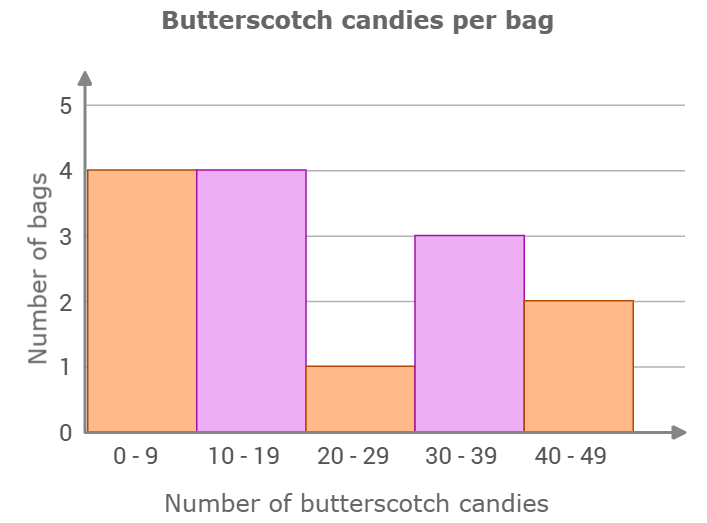
Click to set the height of the missing bar.
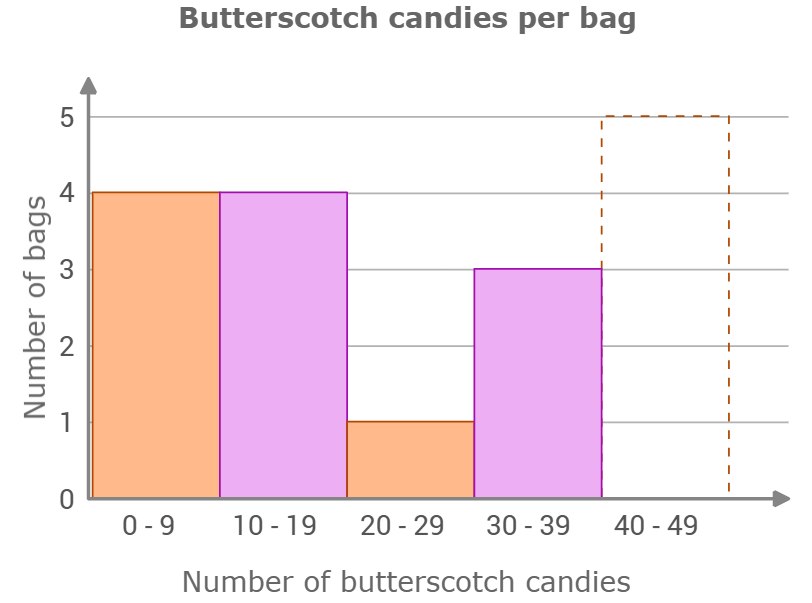
The missing bar is for the range 40 – 49 butterscotch candies. Count the number of values in this range. 2 bags had between 40 and 49 butterscotch candies. Set the height of the bar to 2.
A food magazine published a listing of local restaurant ratings.
Use the data in the table to complete the histogram below.
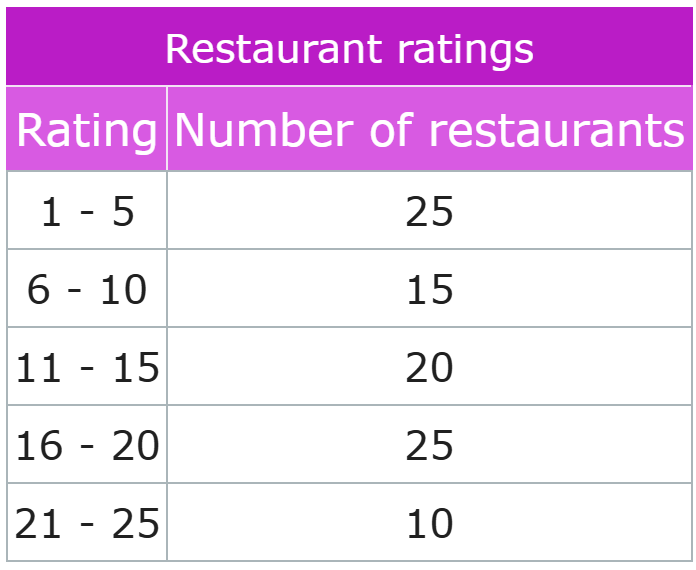
Click to set the height of the missing bar.
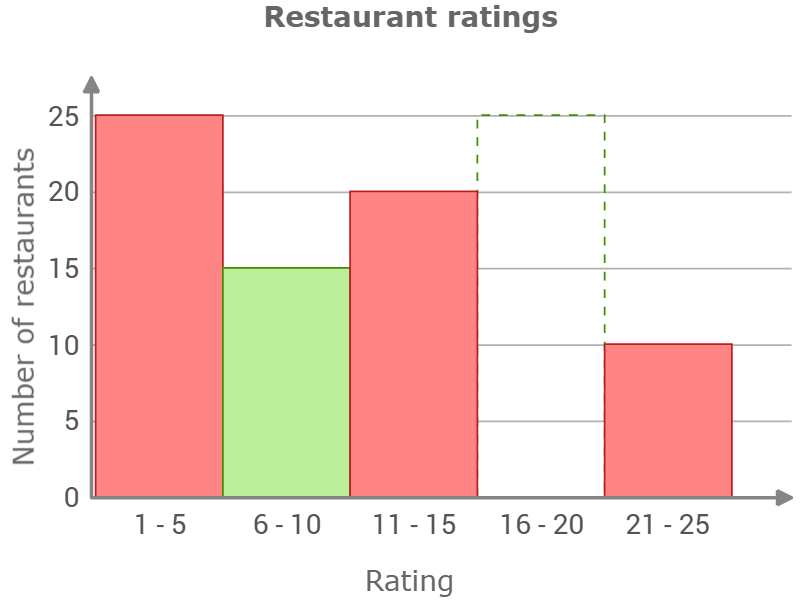
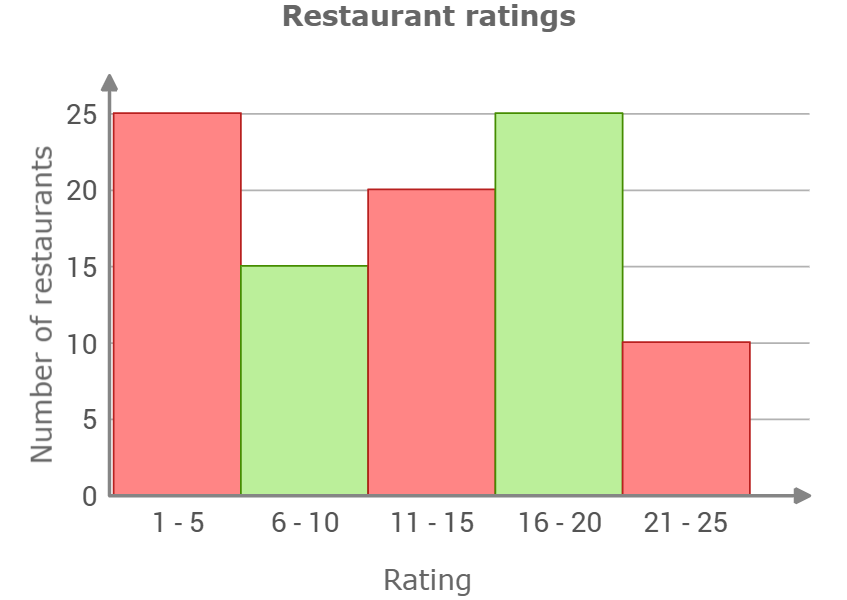
The missing bar is for the range 16 – 20 points. 25 restaurants were rated between 16 and 20 points. Set the height of the bar to 25.
Let’s practice!🖊️